dB Peak, RMS, LUFS, True Peak and Crest Factor: comparison and summary table
Introduction
You open your DAW and you already have at least two different volume readings. The you open any analyzer like Youlean or Insight and you see many more. They all talk about "decibels," they all measure volume level, but no two measurements are exactly the same.
This confusion is one of the reasons you get stuck asking "what's the correct level?" without ever reaching a clear answer: the question itself is incomplete if you don't know relative to which measurement. Knowing which level to look at at each moment will let you understand what's actually happening on your track, bus, group, or mix. In this article, I lay out every concept, one by one, so you understand exactly what it means and how they differ from each other.
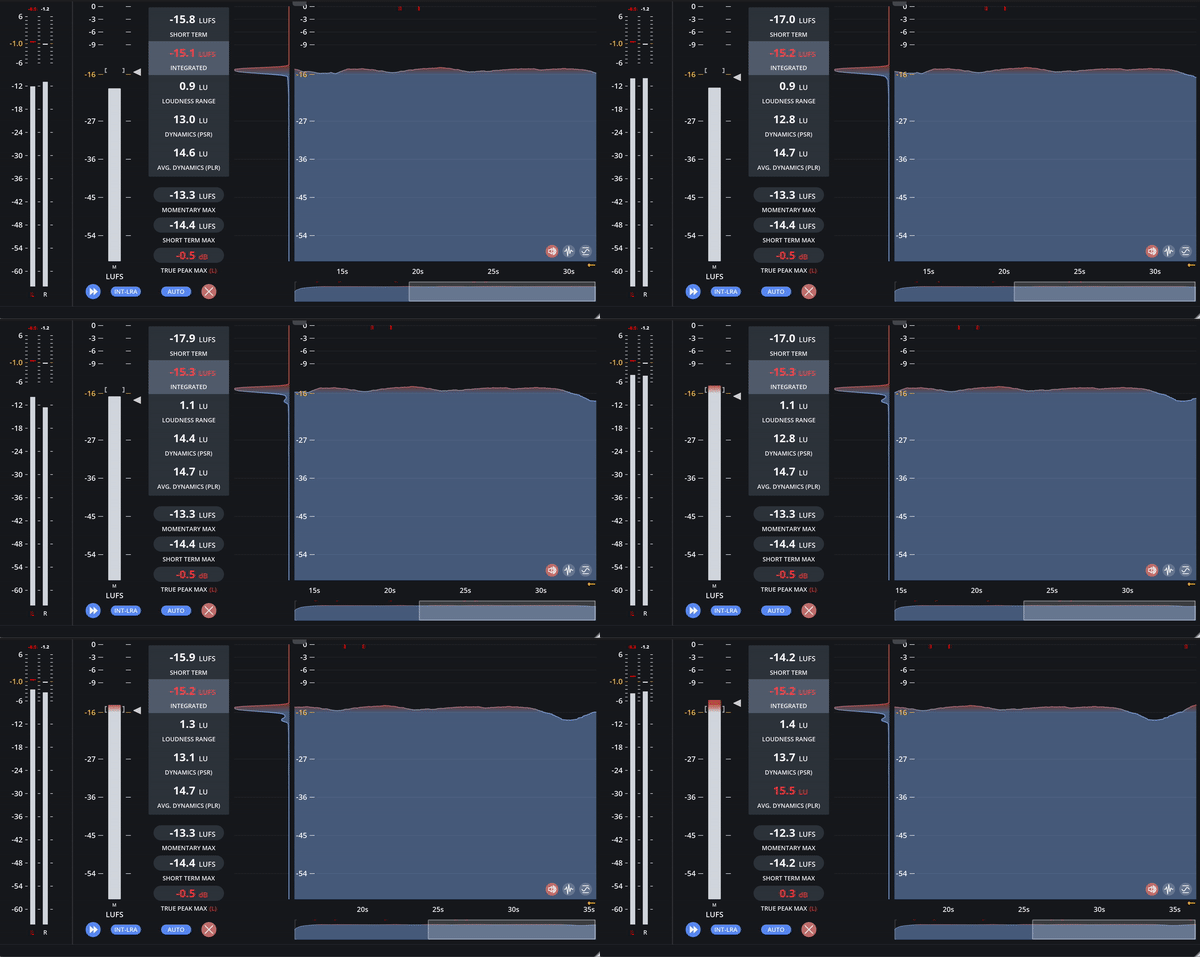
Youlean Loudness Meter
dB: the unit, not the measurement
dB (decibel) is not an absolute measurement, but a relative one. It always expresses the signal level (usually power) relative to a reference level, on a logarithmic scale.
There are several decibel units: dBFS, dB SPL, dBu, dBV, dBA, etc. What changes is precisely that reference point. When someone mentions, say, -6 dB, they can mean different things depending on the reference in question.
When we talk about audio, and about production, mixing, and mastering in general, we use dBFS and dBTP.
dBFS and Peak: the instantaneous peak
dBFS (Decibels Full Scale) is the unit used in the digital domain:
- 0 dBFS is the absolute ceiling. You can't go any higher: if you do, the signal gets clipped.
- -6 dBFS is six decibels below that ceiling.
- -∞ dBFS is silence.
Technical note: this absolute ceiling is what you'll find at the final output stage (sound card, export). Internally, however, modern DAWs process audio in 32-bit floating point (or 64-bit), which allows levels to exceed 0 dBFS without distorting. What you do need to avoid is having the final master, once exported, exceed that ceiling.
Peak is a measurement of those same dBFS values, applied to the single highest instantaneous value of the signal. When a track's level meter in your DAW reads "-6 dB," it's literally telling you: "this track's peak reaches -6 dBFS." It's extremely fast and reactive: a single transient lasting a thousandth of a second is enough to trigger it.
What it's for: knowing the maximum peak of a track, or whether a track is clipping, at the digital sample level. Limitation: it doesn't catch everything. There are real clipping events that a standard Peak meter, as shown in your DAW, simply doesn't see. That's where True Peak comes in.
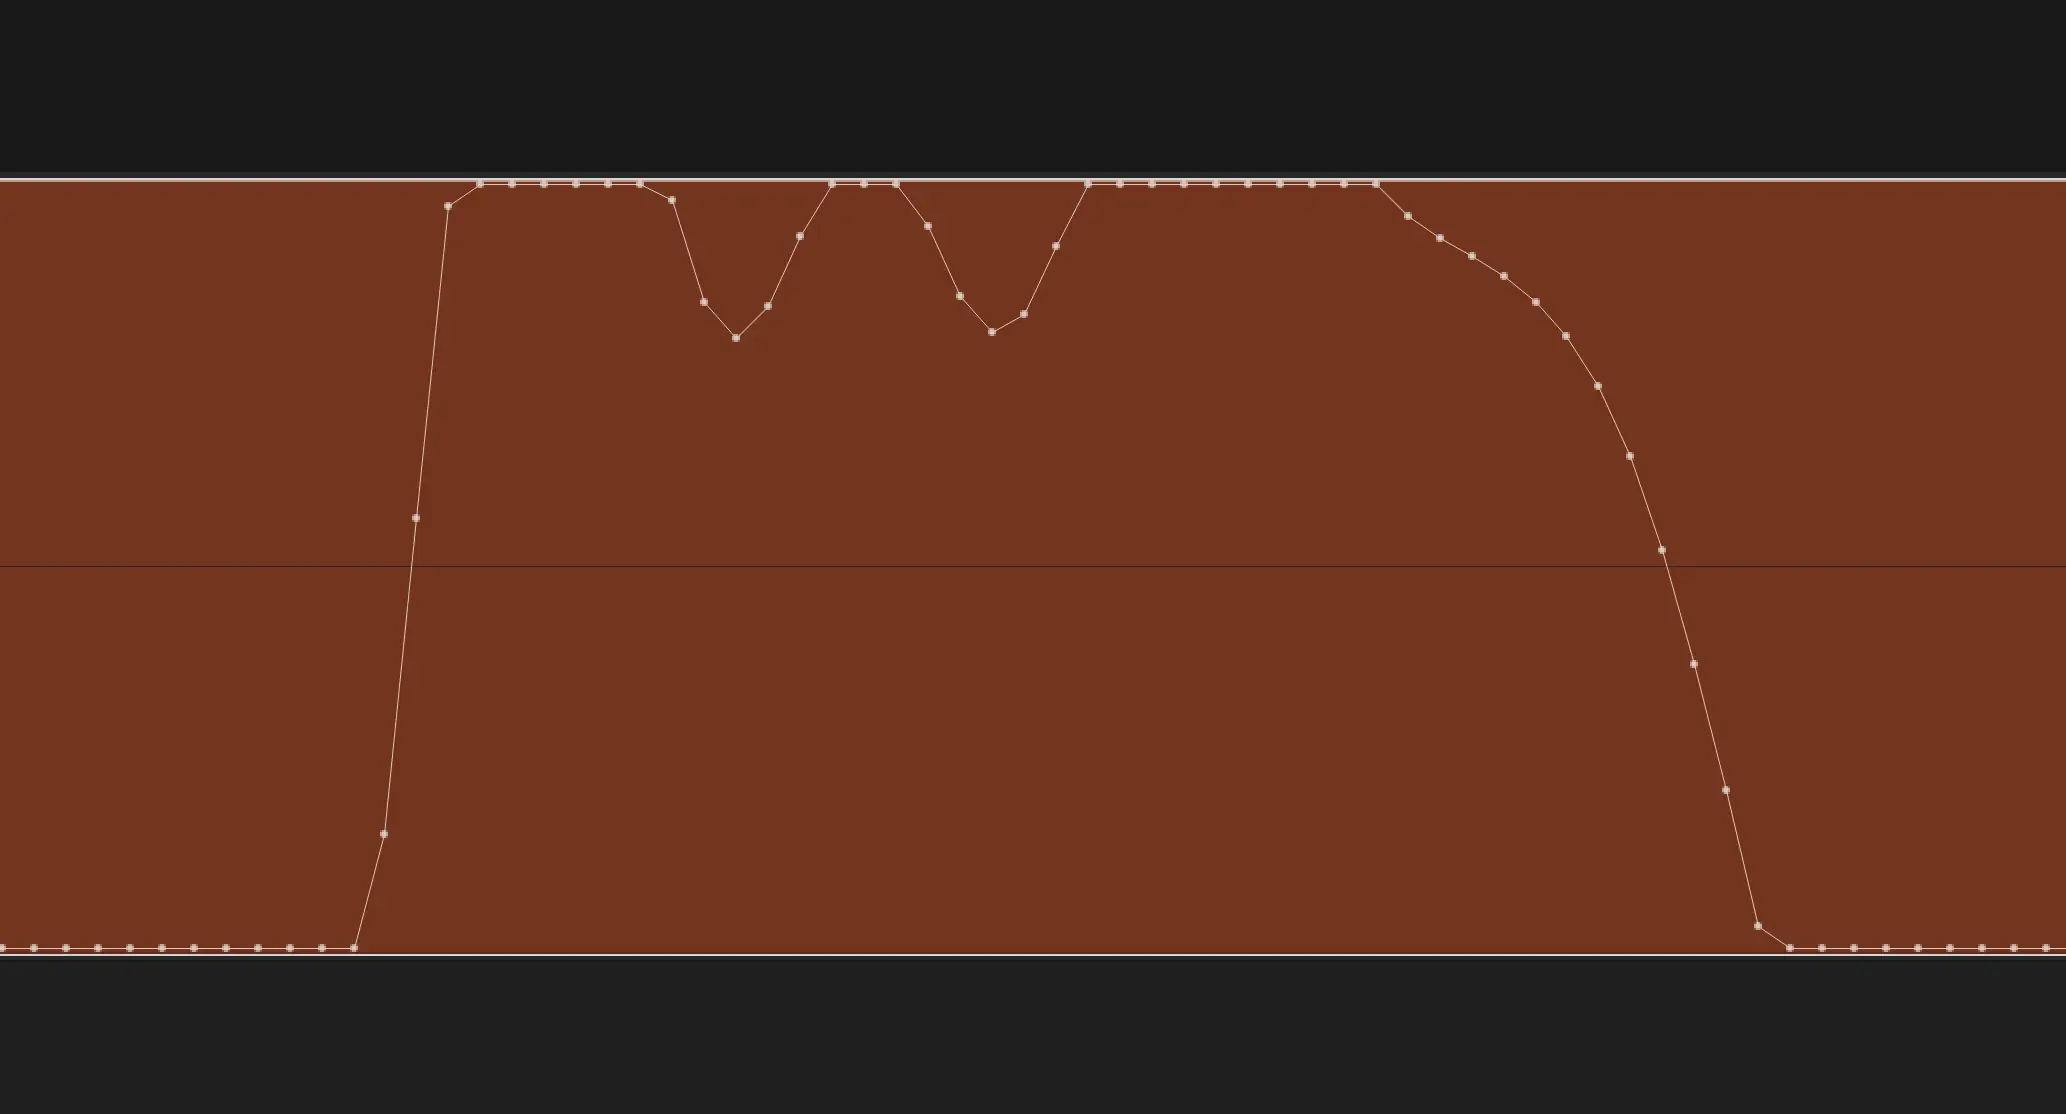
Waveform sample with Peaks above 0 dBFS
But what exactly is clipping?
When the signal tries to exceed 0 dBFS, there's no available value to represent it above that ceiling, so the tip of the waveform gets cut off flat: the original rounded curve turns into a flat surface. That abrupt cut generates new harmonics that weren't present in the original audio, and it's what we hear as harsh, unpleasant distortion. In a floating-point DAW you can undo this by lowering the gain before the final export, but once the signal has been converted and printed to a fixed-bit format (for example, when exporting the final WAV at 16 bits), the information lost in that cut can no longer be recovered.
True Peak: the peak that standard Peak metering can't see
Normally, standard Peak meters can't detect real clipping. When a digital signal is reconstructed as analog (D/A conversion) or encoded into a lossy format (MP3, AAC), the waveform is reconstructed between the digital samples through interpolation (sinc interpolation), a process that rebuilds the wave from the samples before and after it, and so in that process and between the peak values you'd normally see, new peaks can appear that exceed 0 dBFS even though no individual digital sample shows it.
These are known as intersample peaks (peaks between samples), and they can reach +1, +2, or even +3 dB above the digital peak you see in your DAW.
True Peak (dBTP) is a measurement that applies oversampling to the signal in order to estimate these "invisible" peaks, using oversampling techniques, typically x4 or x8, to reconstruct the digital waveform and accurately predict the peaks that will appear once the signal reaches the analog domain. It's the standard used by streaming and broadcast platforms to ensure audio won't distort once it goes through their own conversion or encoding process. That's why many standards (such as EBU R128) and platform recommendations require a True Peak margin of -1 dBTP.
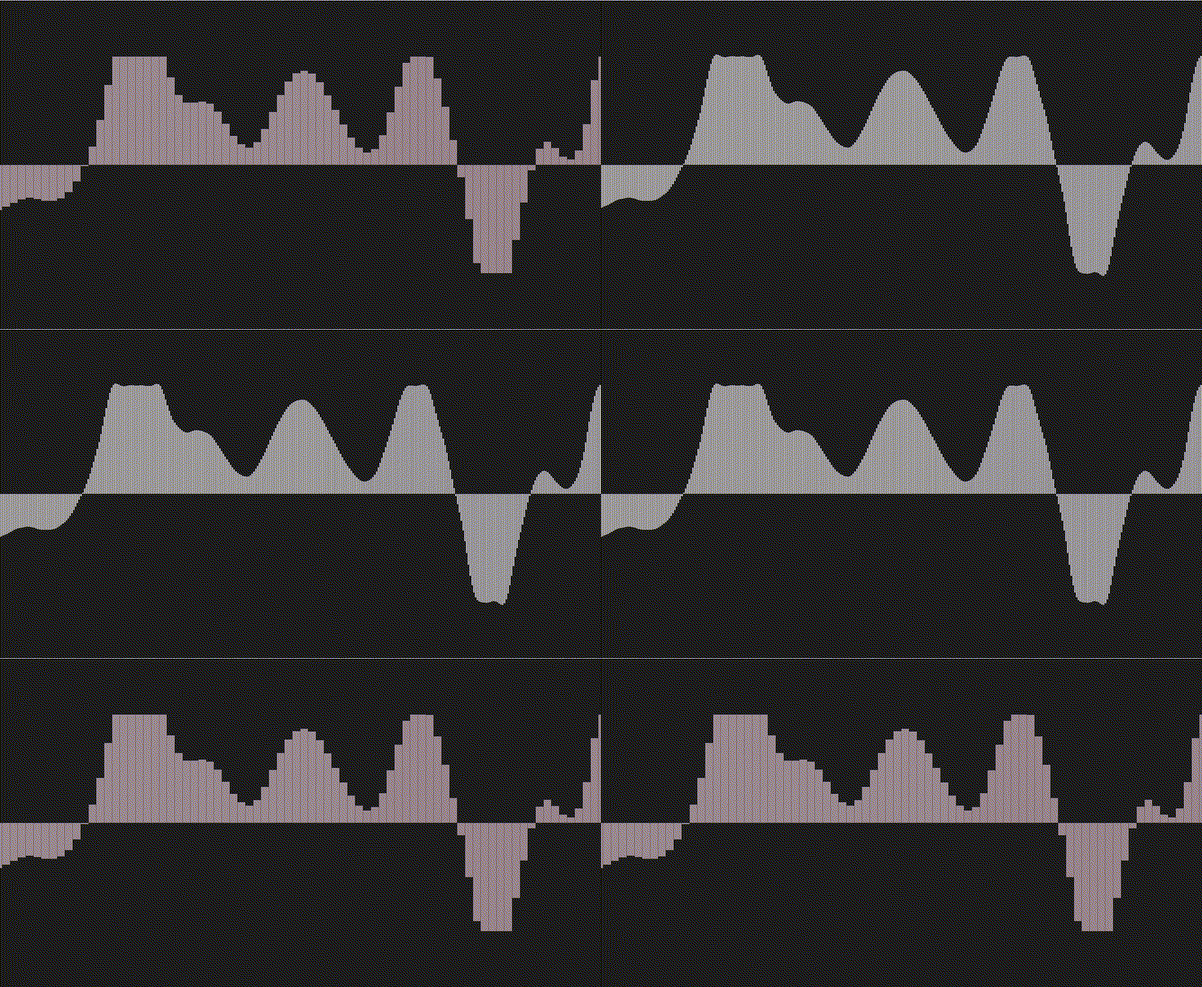
Sinc interpolation
What it's for: knowing whether you'll get distortion once your audio leaves the DAW and heads out into the real world. Peak and True Peak will help you know whether distortion will show up, but neither one actually tells you whether your track sounds loud or quiet: for that we need two completely different measurements: RMS and LUFS.
RMS: the measurement of average energy
RMS (Root Mean Square) calculates an average of the signal's energy over a time window, instead of just looking at the single highest sample. The AES17 standard uses a 300 ms window to measure RMS, since this is a much closer approximation to how we perceive volume: our ears don't react to a thousandth-of-a-second peak, but to sustained energy.
- A snare hit has a high peak but a low RMS: energy concentrated in a single instant.
- A sustained bass note has a peak similar to its RMS: energy sustained over time.
A heavily compressed track (little difference between loud and quiet moments) will have an RMS close to its Peak. A very dynamic track, on the other hand, will have an RMS well below its Peak. This difference has its own name, which we'll get to shortly: the Crest Factor.
RMS limitation: the human ear doesn't perceive all frequencies equally. It's more sensitive to mid and high frequencies than to lows, which is why a hi-hat at -12 dB RMS can sound louder to the ear than a bass at -12 dB RMS, even though the meter shows the exact same number. This is where LUFS comes in.
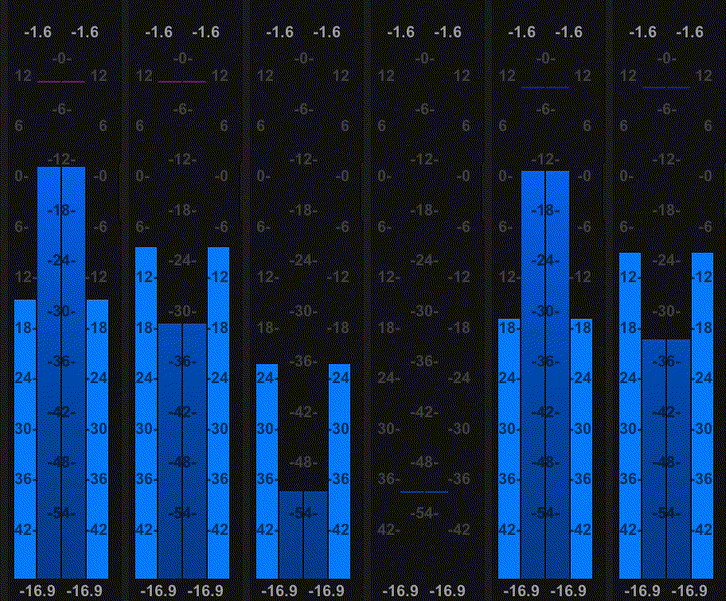
Peak and RMS levels
LUFS: how the human ear actually works
LUFS (Loudness Units relative to Full Scale) goes one step further than RMS: it's not just an energy average, but a measurement designed to approximate how our ears actually perceive volume, following the ITU-R BS.1770 standard. It applies frequency weighting (K-weighting) that gives less weight to very low and very high frequencies (just as our hearing system does), and ignores silent or very quiet passages so they don't skew the average (gating). In other words, it applies an equalizer with a frequency response similar to our hearing, adds a relative noise gate so the average isn't thrown off by a very quiet section of the song (a brief silence, a break, etc.), and then calculates the average energy.
It has three different time windows, depending on what you want to observe:
| Type | Duration | What it's for |
|---|---|---|
| Momentary | 400 ms | Measuring a very short passage |
| Short-term | 3 s | Measuring the level of a specific section |
| Integrated | Whole track | Measuring the overall level of the full track |
LUFS is therefore the current standard unit for normalizing mastered audio, both in music and video playback systems and in broadcast systems such as streaming or television. Some common reference values used by the most popular music streaming platforms (these are guidelines only: each platform can adjust them over time, so verify before treating them as final):
- Spotify: -14 LUFS Integrated
- YouTube: -14 LUFS Integrated
- Apple Music: -16 LUFS Integrated
- Tidal: -14 LUFS Integrated
- SoundCloud: -14 LUFS Integrated
What it's for: knowing what target volume to publish at on each platform, according to their own documentation.
Important note: *these values are the stated policy, not a guarantee of what you'll actually hear. In practice, it's very common to find tracks on these platforms at -6 or -8 LUFS, with no apparent attenuation. The reasons can vary: the player version, the user's settings or account type, changes to the algorithm over time, or the region the track is being played from.
The practical takeaway: master with the intention and dynamics that your track and style actually need, verify with your own metering, and don't chase the number in the official documentation (unless someone explicitly asks you to).*
Crest Factor: the relationship between the Peaks and the RMS
The Crest Factor isn't itself a measurement, but a ratio between the Peak and the average that gives us a reading of the dynamics.
A high Crest Factor indicates a very dynamic signal, with short, isolated peaks above a much lower average (for example, an uncompressed acoustic drum recording, or a song with few elements). A low Crest Factor indicates a heavily compressed or limited signal, with the Peak and RMS nearly touching (for example, a very tightly limited electronic or metal master).
There's no single "correct" universal Crest Factor, it depends entirely on the genre and the artistic intent, but as a rough reference point, we can use the following table:
| Crest Factor | What it usually indicates | Musical genre |
|---|---|---|
| 20 dB or more | Very dynamic, wide range | Acoustic jazz, classical |
| 14–18 dB | Natural dynamics | Rock, pop with dynamics |
| 10–14 dB | Compressed, cohesive | Modern pop, hip-hop |
| 6–10 dB | Heavily compressed | EDM, metal, techno |
| Under 6 dB | Extremely limited | Hardcore, dubstep, Drum & Bass |
A jazz track might have an 18 dB Crest Factor with a -18 LUFS Integrated, and an EDM track might have an 8 dB Crest Factor with a -8 LUFS Integrated: both can sound "at their own volume" within their genre. The number is neither good nor bad on its own, it's just information for making a conscious decision, not a target to chase.
The modern evolution: PLR and PSR
Two metrics based on the same principle, but far more precise, are used today: PSR and PLR.
PSR (Peak to Short-Term Loudness Ratio): the modern equivalent of the Crest Factor. Dynamics are calculated using True Peak against LUFS Short-Term (3 seconds). If, during an intense part of the song, the PSR drops below 5 or 6, that could tell you the track is being over-compressed and the transients have disappeared.
PLR (Peak to Loudness Ratio): the measurement used to calculate the macro-dynamics of the whole track. It's calculated using the maximum True Peak and the LUFS Integrated.
For example, you might get a high PLR if the song has a very quiet or sparse section (say, the intro) and a more intense ending, while the PSR could still be small during the intense part because that section has more elements and more compression. Checking the PSR during the most intense sections helps you decide whether you've lost impact, or whether, on the contrary, you can still "push" it further.
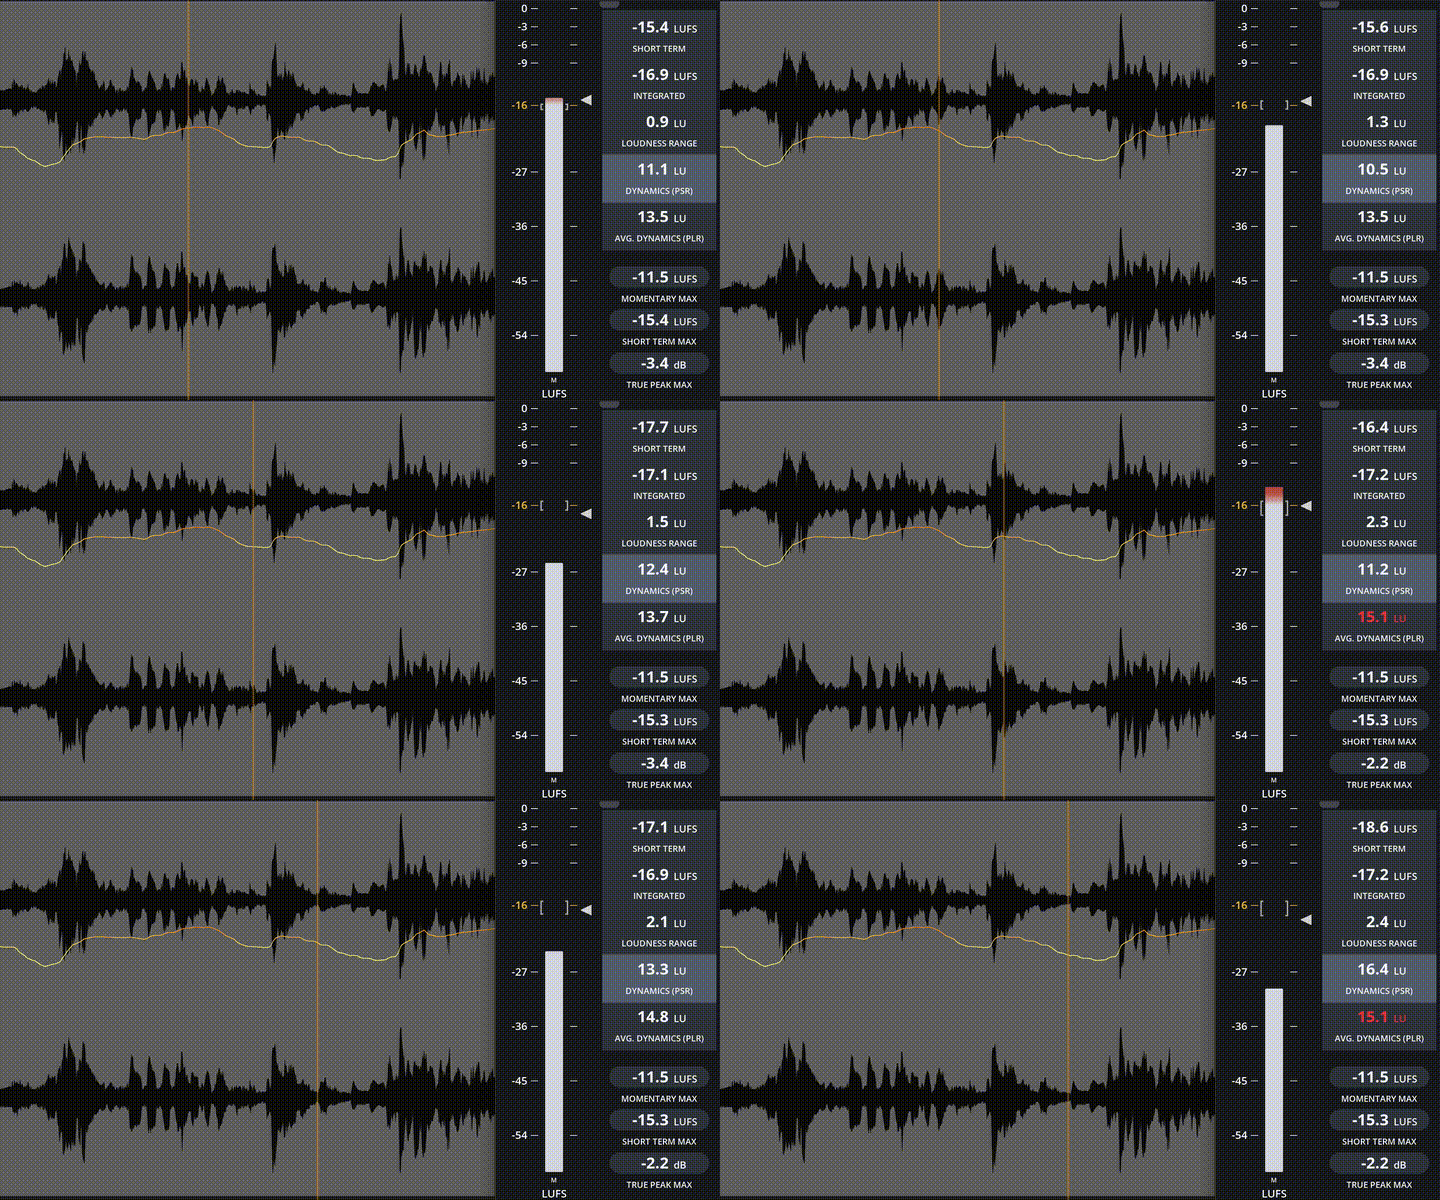
PSR of a Jazz track and Loudness line over the waveform
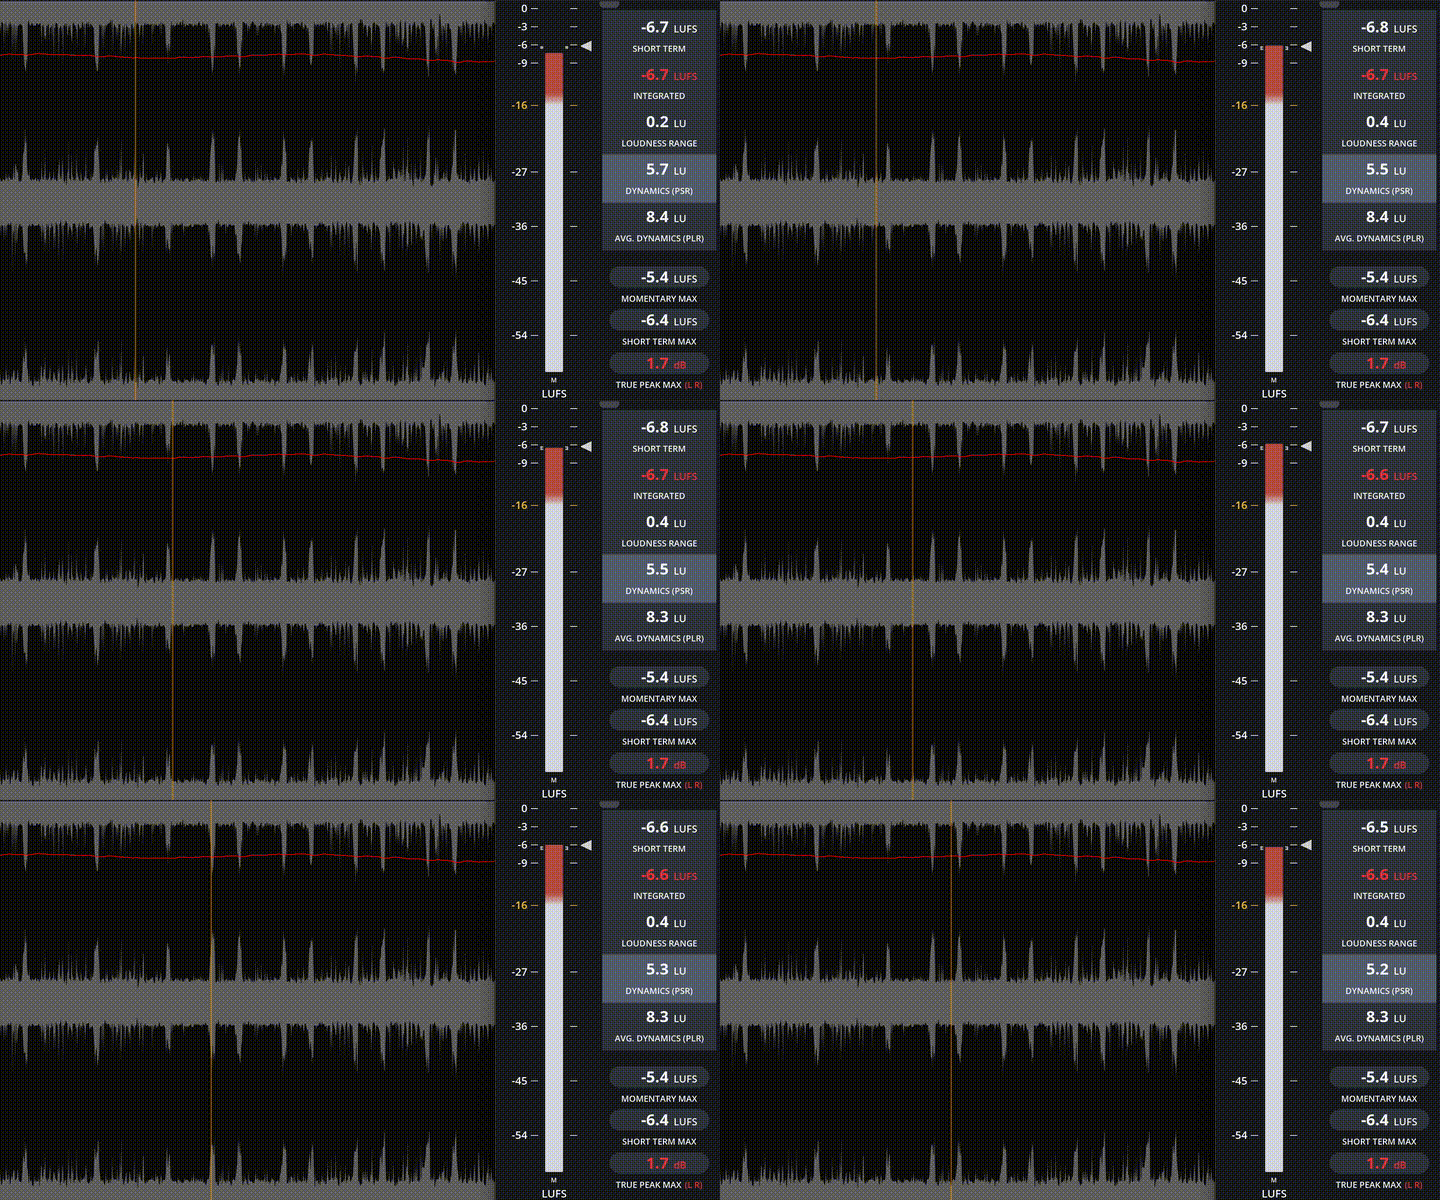
PSR of an Electronic track and Loudness line over the waveform
Example: measuring the same audio fragment
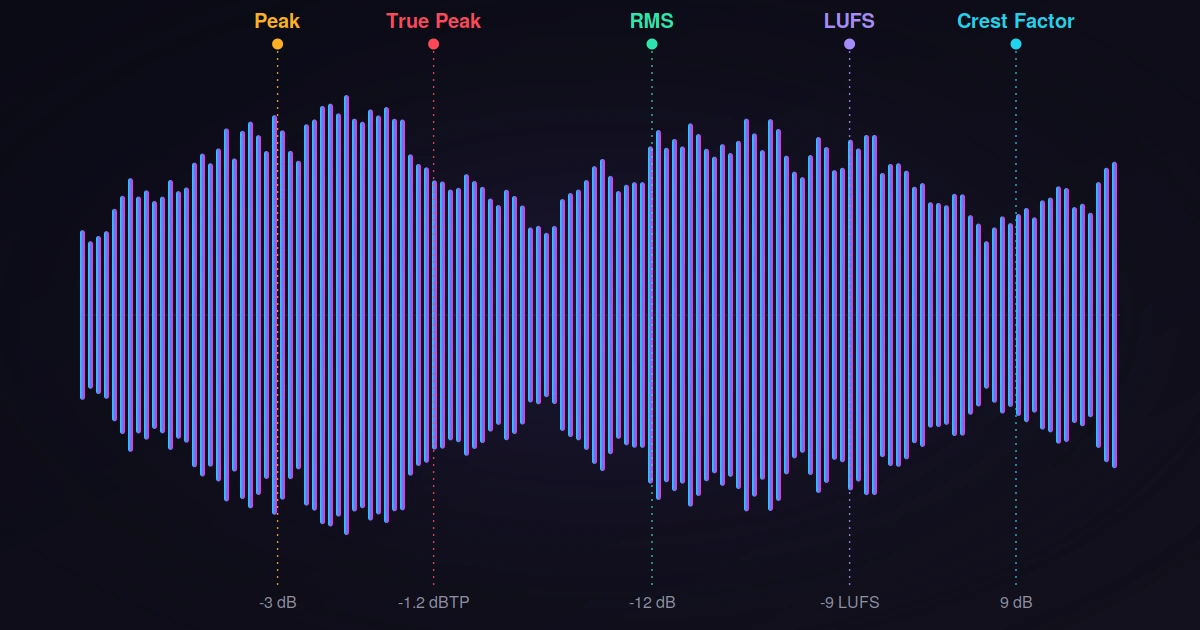
A 10-second passage from a song gives us all of these different readings at once:
| Measurement | Example reading | What it means |
|---|---|---|
| Peak | -3 dB | The passage's highest peak reaches -3 dBFS. No clipping |
| True Peak | -1.2 dBTP | Once the analog waveform is reconstructed, the real peaks reach -1.2 dBTP |
| RMS | -12 dB | The average level is -12 dB |
| LUFS Integrated | -9 LUFS | Once frequency-weighted and measured over the whole passage, the equivalent perceived loudness is -9 LUFS |
| Crest Factor (PSR) | 9 dB | TruePeak/LUFS ratio of 9 dB |
Five readings, one single audio passage, and none of the five contradicts the others but each one simply answers a different question.
Summary table
| Measurement | What it measures | Time behavior | What it's mainly used for |
|---|---|---|---|
| dBFS (scale) | Digital reference relative to the absolute ceiling (0 dBFS) | - | Base unit of measurement for all digital meters |
| Peak | The highest volume level at each instant | Instantaneous, very reactive | Avoiding digital clipping (no sample exceeding 0 dBFS), or knowing a track's maximum peak |
| True Peak (dBTP) | Real peaks after analog reconstruction or encoding, including those that occur between samples | Instantaneous (with oversampling) | Avoiding distortion after D/A conversion or lossy encoding |
| RMS | Average energy over a time window | Averaged, integrated | An approximation of perceived volume, useful for comparing dynamics |
| LUFS | Perceived loudness, with frequency weighting and gating, similar to how our hearing system perceives sound | Integrated / short-term / momentary, depending on the variant | Volume normalization, comparing real loudness between tracks |
| Crest Factor (PSR) | Difference in dB between the TruePeak and the LUFS of the same signal | Short-term | Diagnosing the dynamics of a track or passage |
Common mistakes
- Confusing dBFS/Peak with perceived loudness: A -6 dB peak can sound very loud (if it's dense) or very quiet (if it's a brief transient). Peak only tells you about the digital ceiling, not how loud the track actually sounds.
- Relying on Peak alone to avoid distortion: The final format will go through an analog conversion or a lossy encoding process (MP3/AAC), so you need to watch True Peak (dBTP), not just Peak.
- Obsessing over LUFS Integrated and forgetting True Peak: Your master could sit at -14 LUFS and still have True Peaks hitting +2 dBTP. The result is a track that sounds distorted.
- Ignoring Crest Factor (PSR): Pushing LUFS up by compressing or limiting harder will drain the life out of the mix (lower PSR). The average volume goes up, but the impact disappears.
- Thinking LUFS is a target to hit: It's a normalization ceiling, not a goal. One track can sound loud at -12 LUFS if the mix is good, while another can sound muffled and flat at -6 LUFS if it's over-compressed.
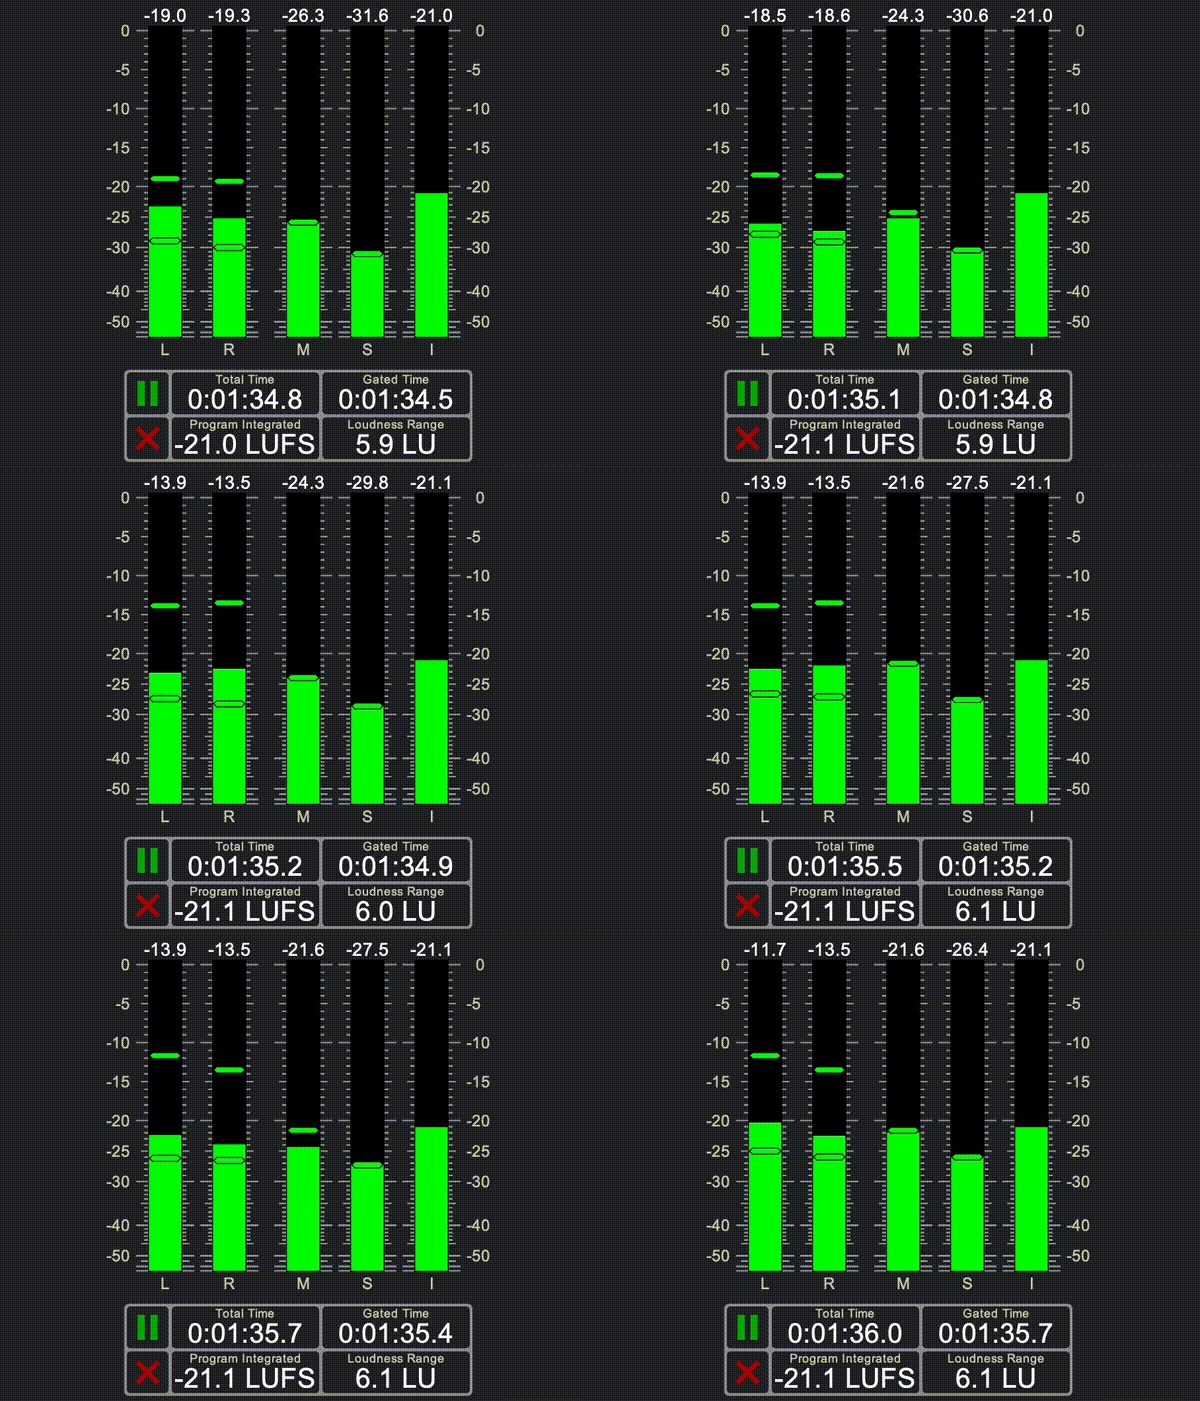
Peak, RMS, LUFS Momentary, LUFS Short-Term and LUFS Integrated meter
Conclusion
Peak, True Peak, RMS, LUFS, and Crest Factor or PSR don't compete with each other: each one answers a different question. Peak tells you whether you're distorting internally. True Peak warns you whether you'll distort out in the real world. RMS and LUFS approximate how loudness is perceived by the human ear. And Crest Factor or PSR reveal how much dynamic headroom your mix has left.
Once you separate these concepts, the endless question of "what's the correct level?" stops making sense. From now on, you'll start asking the right questions at each stage of the process:
- Am I exporting the master without clipping the signal (True Peak)?
- Am I at the target loudness that the genre and the track need, for the platform I'm publishing on (LUFS)?
- Does the chorus or drop still hit as hard as it should (PSR)?
Learn to apply these criteria to real projects, develop your sound knowledge to understand the balance of the mix, and achieve a professional volume. Check out Mixing and Mastering Course.
Author
Subscribe to the newsletter
Receive resources, tutorials and exclusive content directly in your inbox.
Got questions?
Put it into practice and share it with the community
Academy
Want to go deeper?
Our courses are designed to take your sound to the next level. Learn the what, the how and the why.